
THEME 1: CHALLENGING DATA
Most industries and governments are now using advanced technology to collect vast amounts of data. Coping with the size of the data and the speed with which it now arrives has been likened to drinking from a firehose. Advanced sampling and compression techniques are needed to encompass such data.
But size and speed are not the only challenges of the modern data ecosphere. Data sources are increasingly high-dimensional; for example, hyper-spectral satellite data, where the curse of dimensionality means that even the enormous datasets being studied still aren’t enough to populate models, and so dimension reduction techniques are needed.
Many problems require merging of multiple data sources. In medical research, for instance, merging data from multiple cohorts is often needed, where in each cohort the data may not be measured in the same way. Researchers must disentangle the measurement variability from genuine effects. Likewise, network data (e.g. internet traffic data) requires both the data itself, and an understanding of the network structure to make sense of the traffic. Integrating data from different sources is often made difficult because the data lacks common keys for matching.
Other datasets are highly unstructured, for example, natural language data. ACEMS researchers looking at natural language, for instance from large-scale Twitter feeds, need to deal with the inconsistencies of human language, particularly the way abbreviations evolve and expand in online social networks.
Wearable devices introduce many of these problems and more: the data are high-dimensional measurements, with large measurement errors, including important facets that evolve over space and time. Even representing and visualising such complex data is an interesting challenge.
Other data are created in distributional form. For example, particle size distributions are created when measuring particulate matter in environmental monitoring, and internet traffic data are often both subsampled and then summarised into distributional descriptors just to make it possible to record the amount of data in the first place. But when data are recorded in distribution form, we need new ways of modelling the data that underlies these distributions.
The goal for ACEMS researchers working in this area is to distil the important information from these data and also to develop new methods of sampling, cleaning, compressing, representing, modelling and visualising the data to understand the full extent of its capability.
The Numbers
RESEARCHERS
CROSS-NODE COLLABORATION GROUPS
INTERNATIONAL AND INDUSTRY COLLABORATION PROJECTS
People
Key Achievements
Achievements by ACEMS researchers include new methods for dealing with big data, highly structured data and novel sources of data.
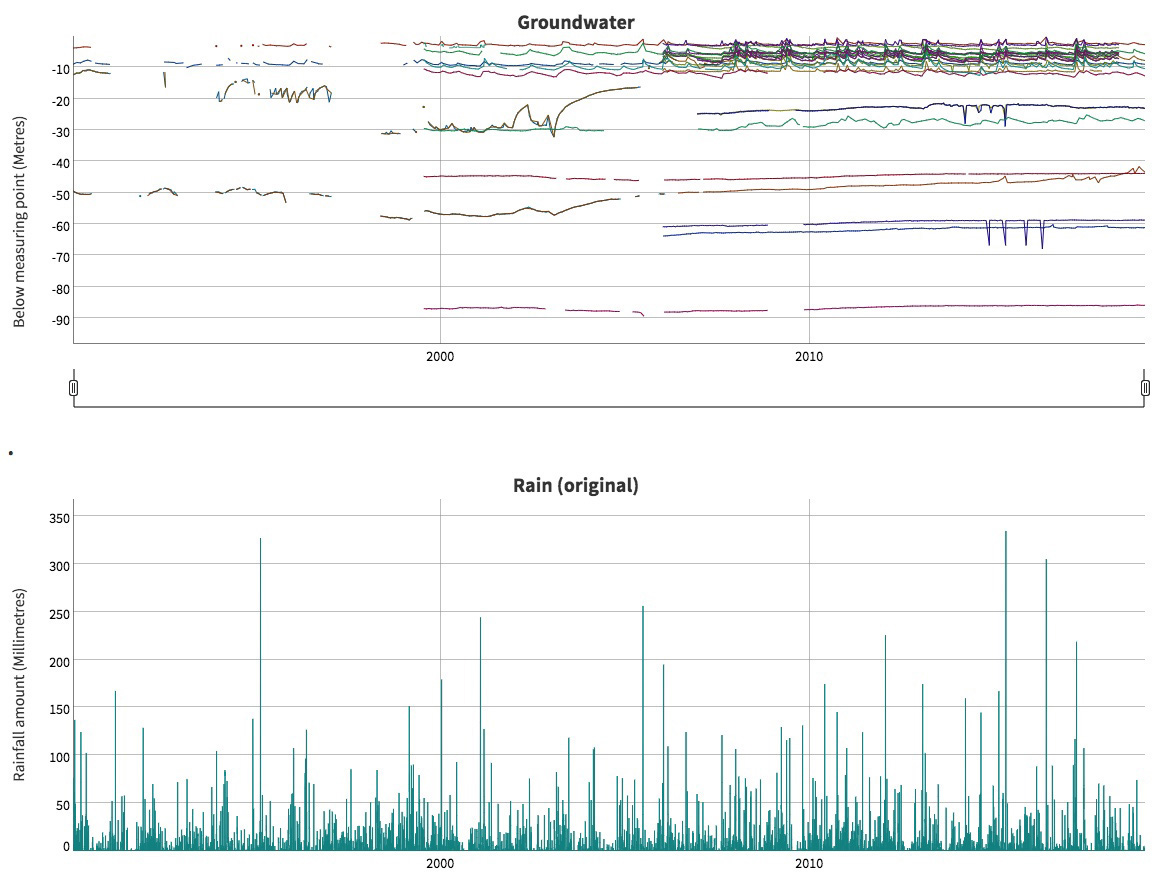
A hydrograph from the cross-node project looking at levels of various groundwater bores in north eastern NSW. The ACEMS team created an RShiny interactive tool that can be used by stakeholders to explore how the levels change over time and also how they respond to rainfall.
CI Louise Ryan reported in the Informed Decisions theme on her work with the NSW Office of the Chief Scientist and Engineer, advising them on decision making under uncertainty. One specific project involved a collaboration with the Monash node, specifically Rob Hyndman and Mitchell O'Hara-Wild, looking at levels of various groundwater bores in north eastern NSW. What they have done so far is to create an RShiny interactive tool that can be used by stakeholders to explore how the levels change over time and also how they respond to rainfall. The project has raised lots of interesting questions.
Collaborators include CIs Louise Ryan, Matt Wand, Research Fellow Dorota Toczydlowska and a collaborator, Tuan V. Nguyen, at the Garvin Institute in Sydney have explored some very interesting data where a group of several hundred women from Dubbo have been repeatedly followed up for many years, with measures of their Bone Mineral Density (BMD), a variety of personal characteristics (height, weight etc), as well as a suite of genetic markers. Of interest is how those markers might be useful in terms of predicting osteoporosis. Their project is innovative in that they are predicting the rate of change of BMD, not BMD itself. The data are revealing some very interesting cohort effects as well, though these are challenging to sort out. For example, women in earlier generations tended to be shorter and lighter, both of which are risk factors for bone loss.
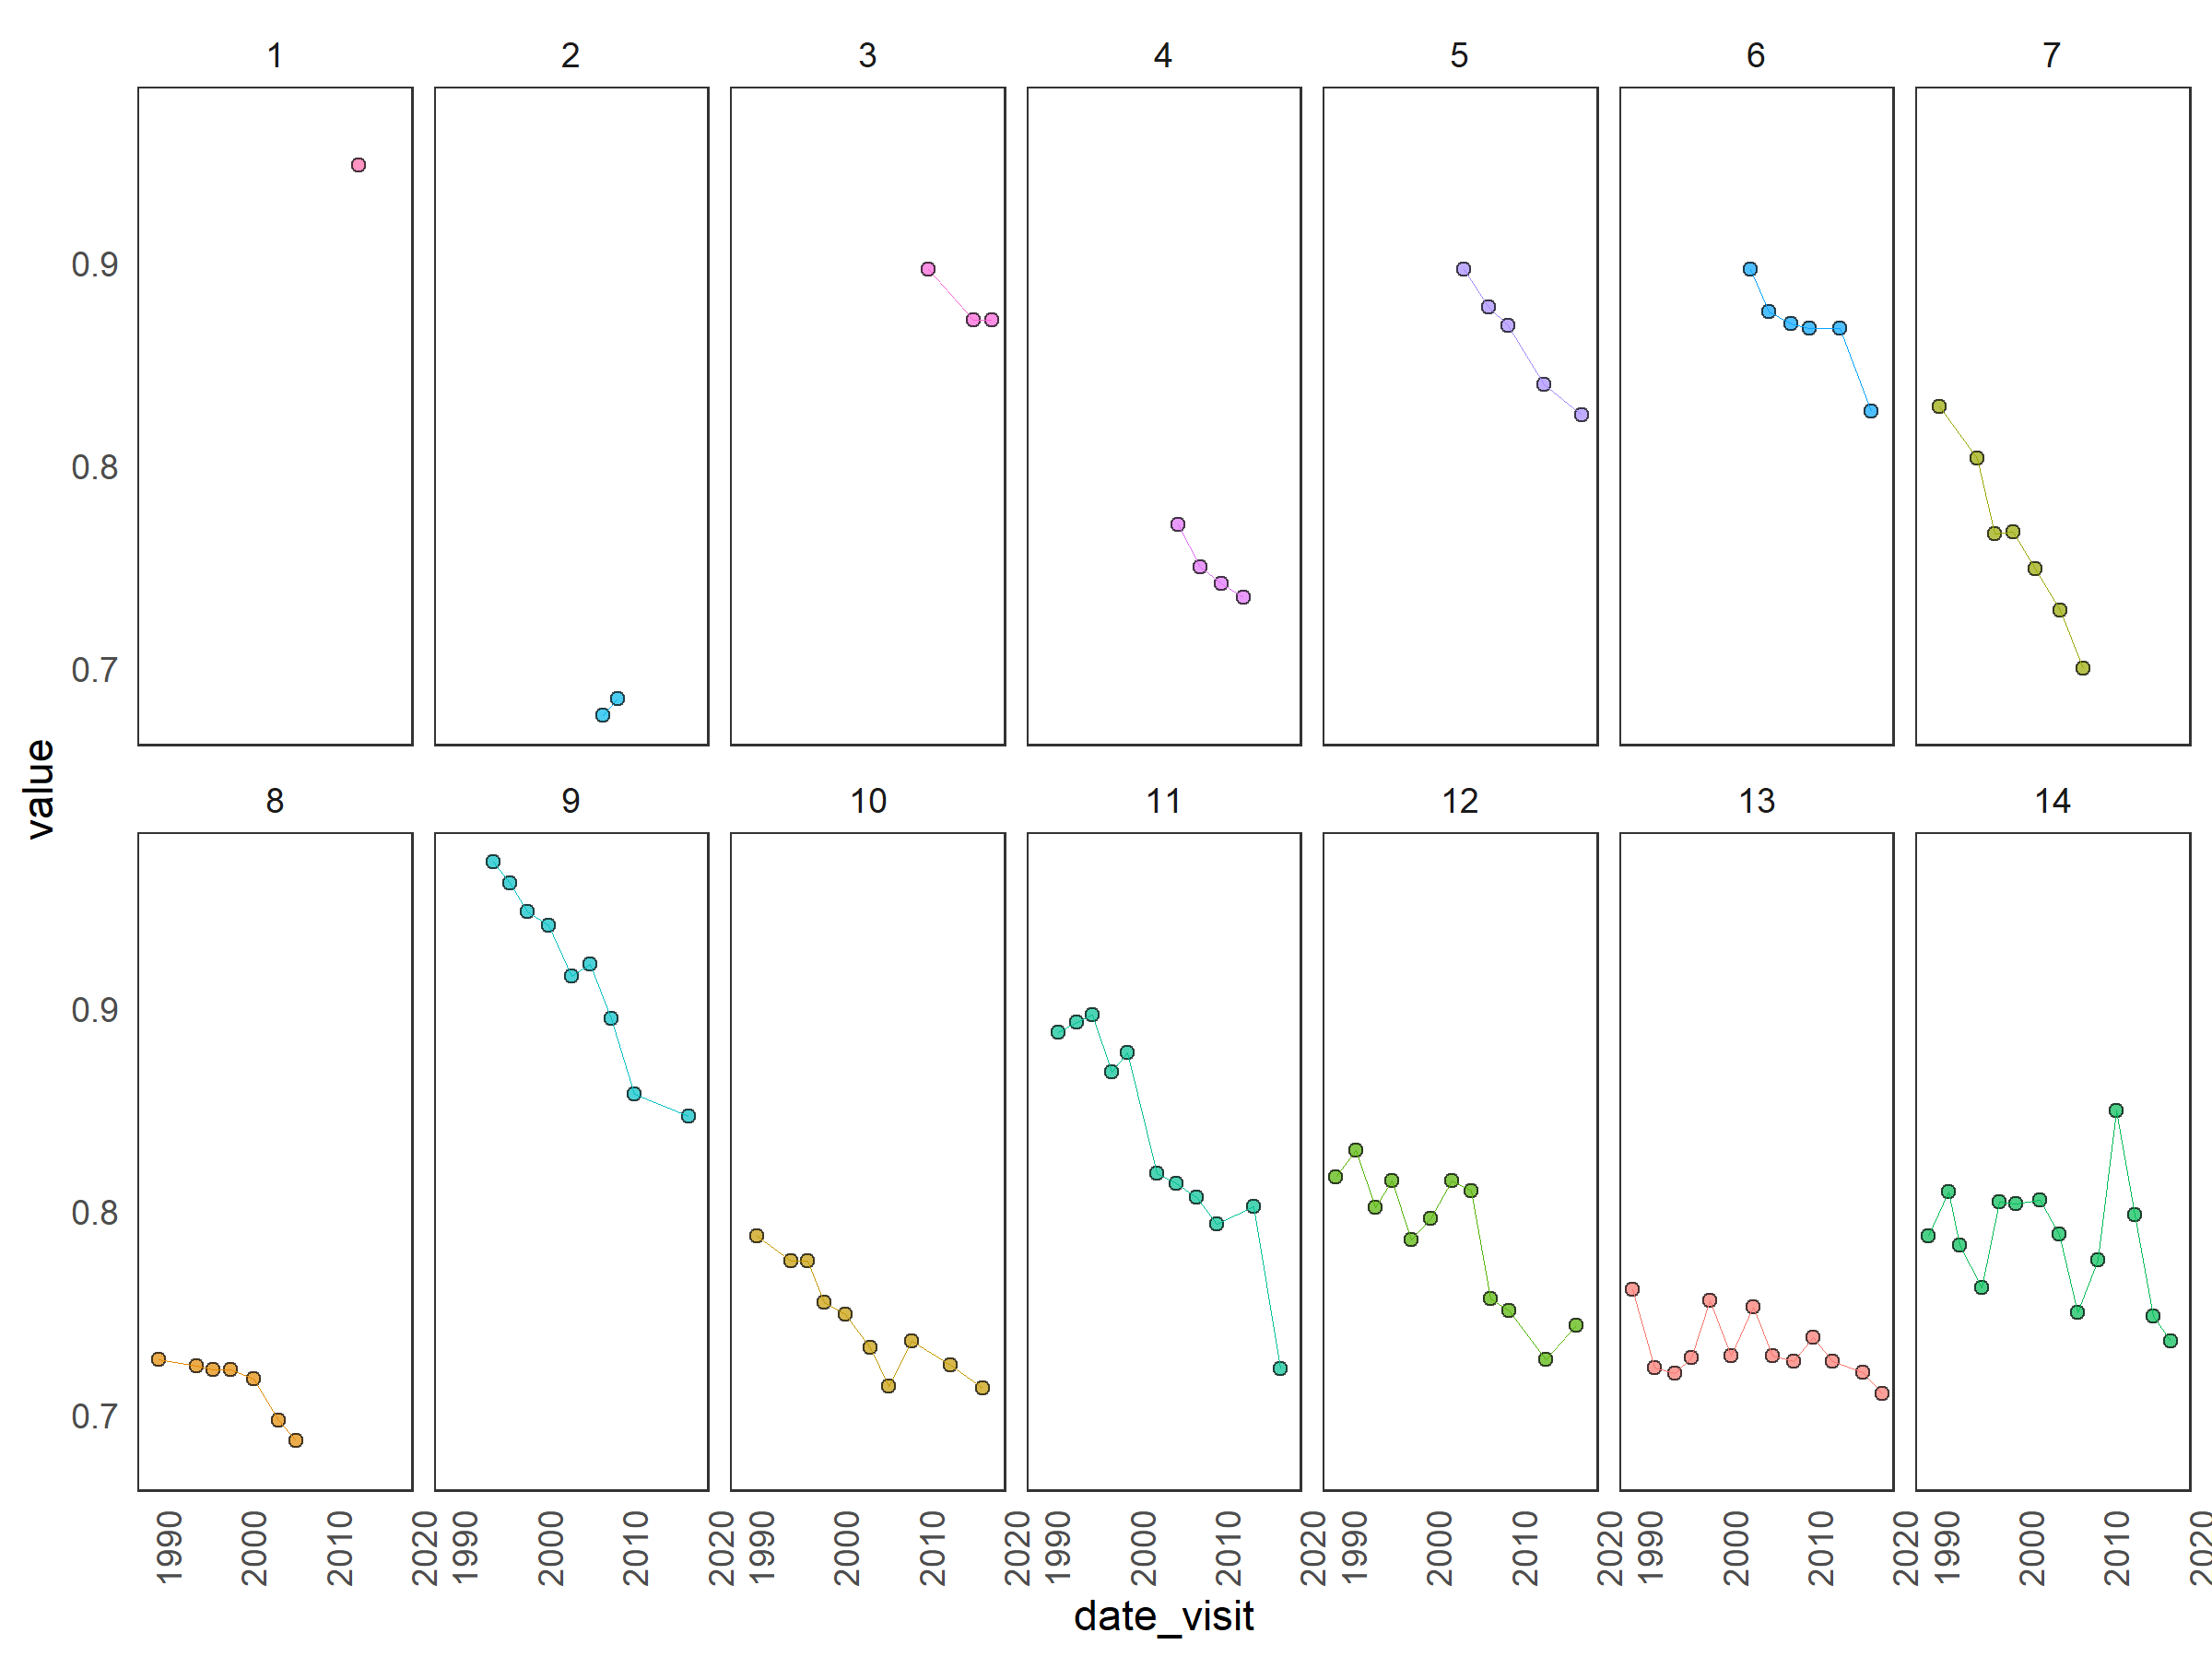
This figure illustrates examples of Bone Mineral Density (BMD) measurements over time for patients with different number of visits (the titles of plots in the grid).
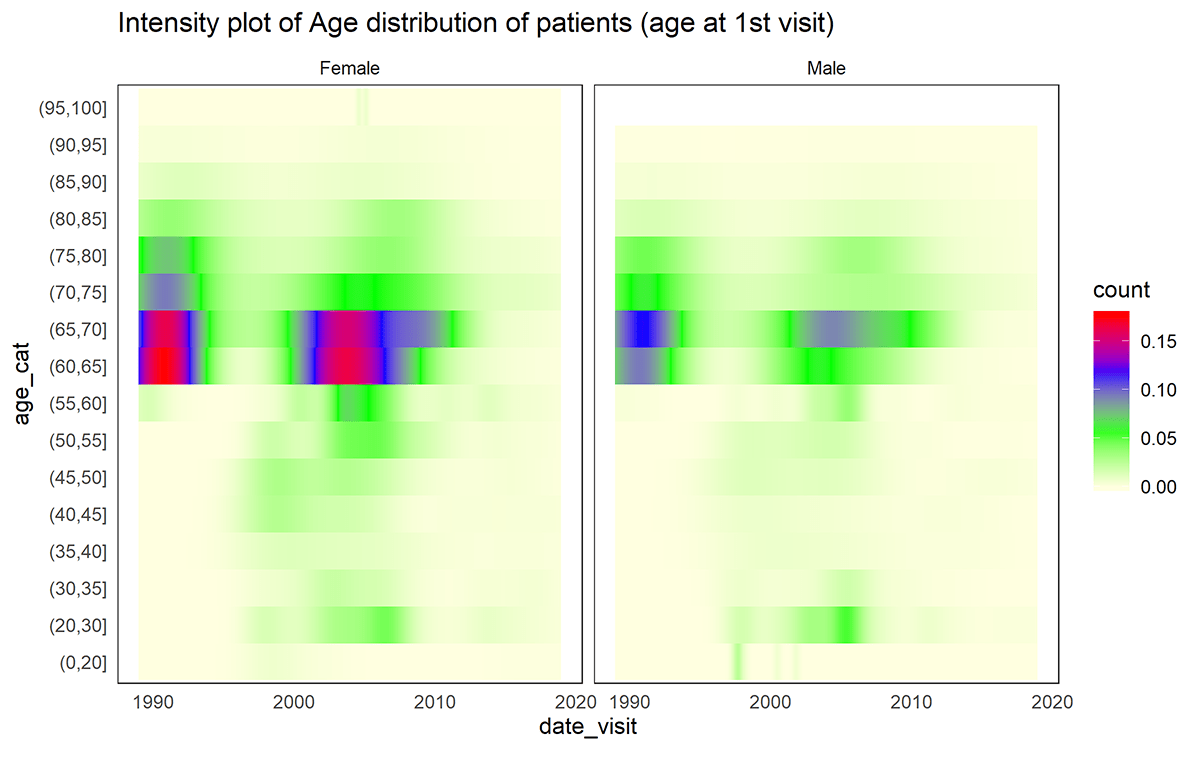
The distribution of patients according to the age at the first visit given the whole available dataset (both female and male).
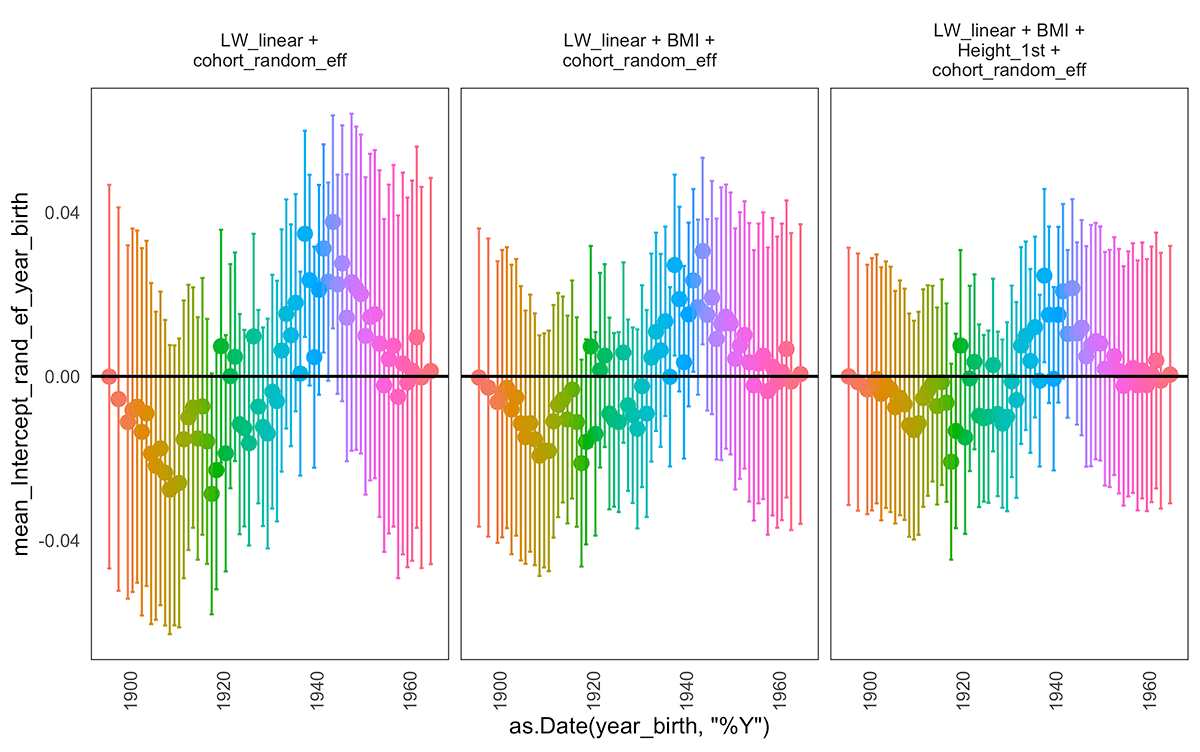
The random intercept corresponding to the year of birth effect in various examined models.
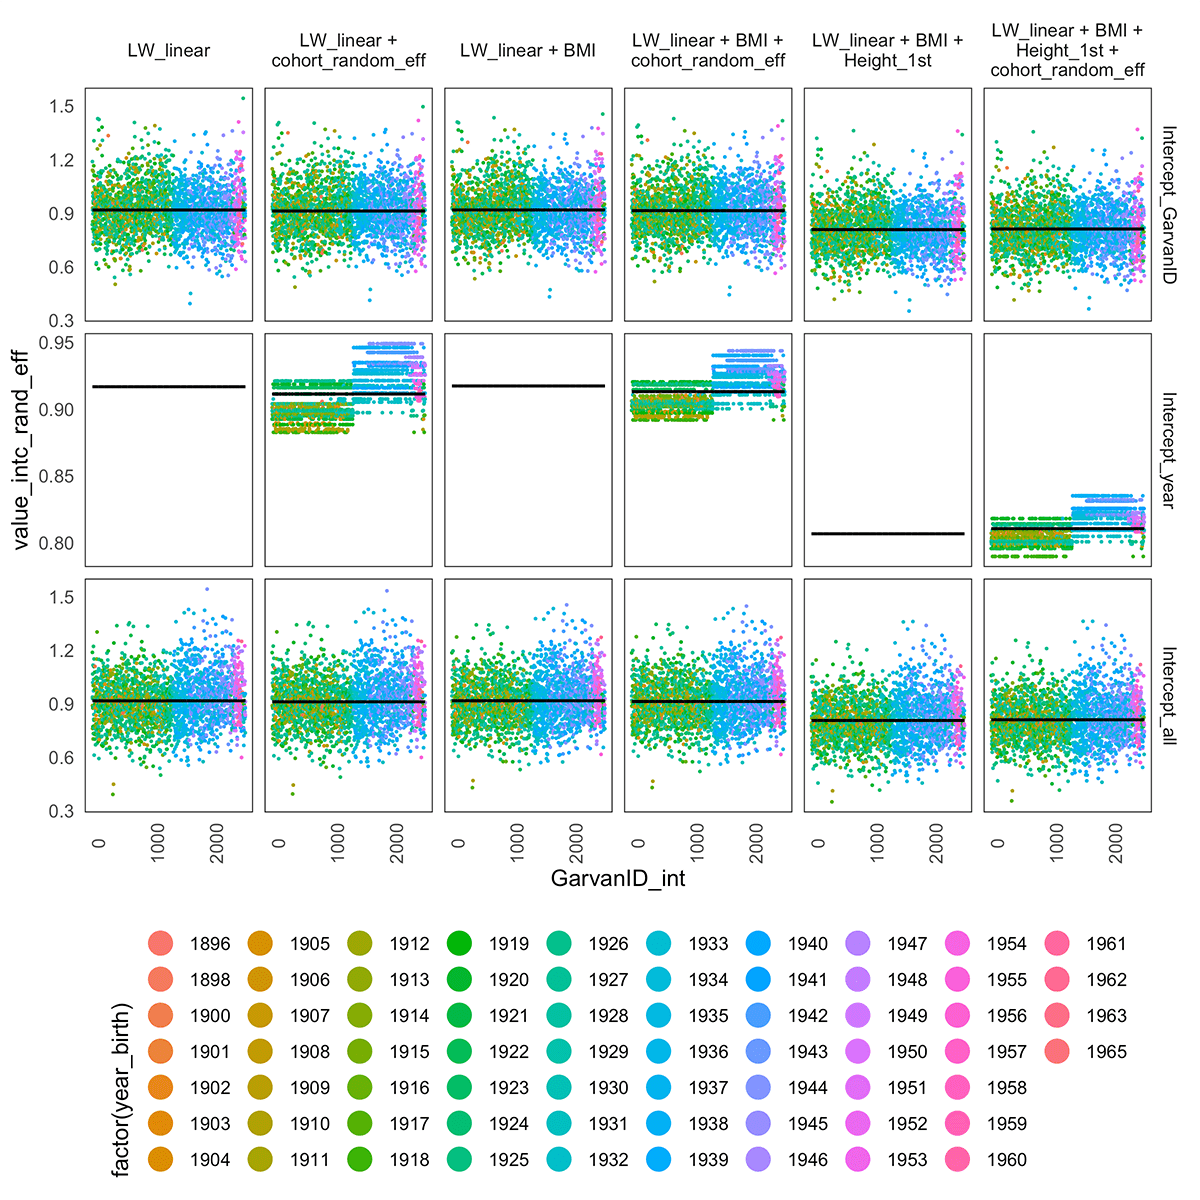
The random intercepts corresponding to the individual effect (top row), year of birth effect (middle panel) and the cumulated intercept per patient (population intercept plus individual random intercept plus year of birth random intercept) over different patients (x-axis) under various model assumptions (whether we add cohort effect, exogenous variables such as BMI or height of a patients measured at the first visit). When we include a measurement of the height of the patient at the first visit (Height_1st) the levels of the intercepts drop. We do not observe the same behaviour with random slopes.
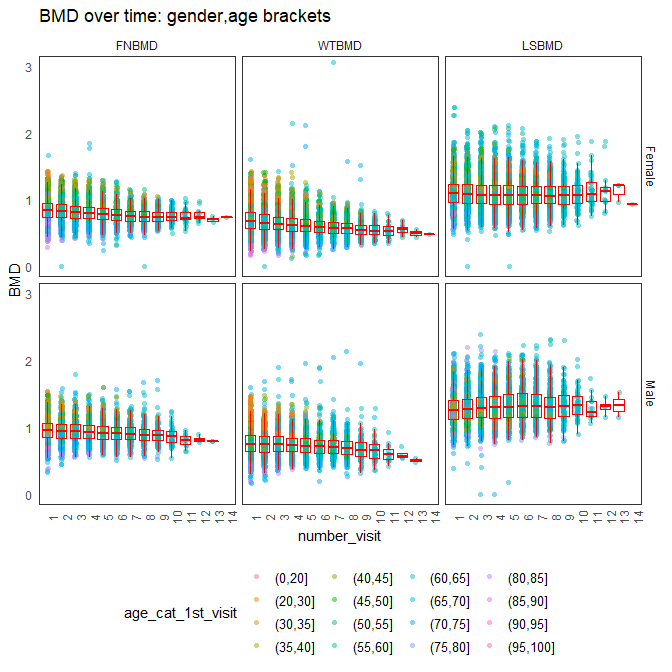
The summary of the BMD measurements over subsequent visits (x-axis) of patients (female and male) categorised by the location of the measurement (FN, WT, LS) with colours corresponding to the age bracket from the first visit.
Internet queries can be highly informative about health in general and infectious diseases in particular, as showcased by the Google Flu case. ACEMS researchers and colleagues at QUT have been working on the association of sociodemographic factors and internet query data with pertussis infections (whooping cough) in China, with a view to establishing an early warning system for the disease and hence more effective local management strategies.
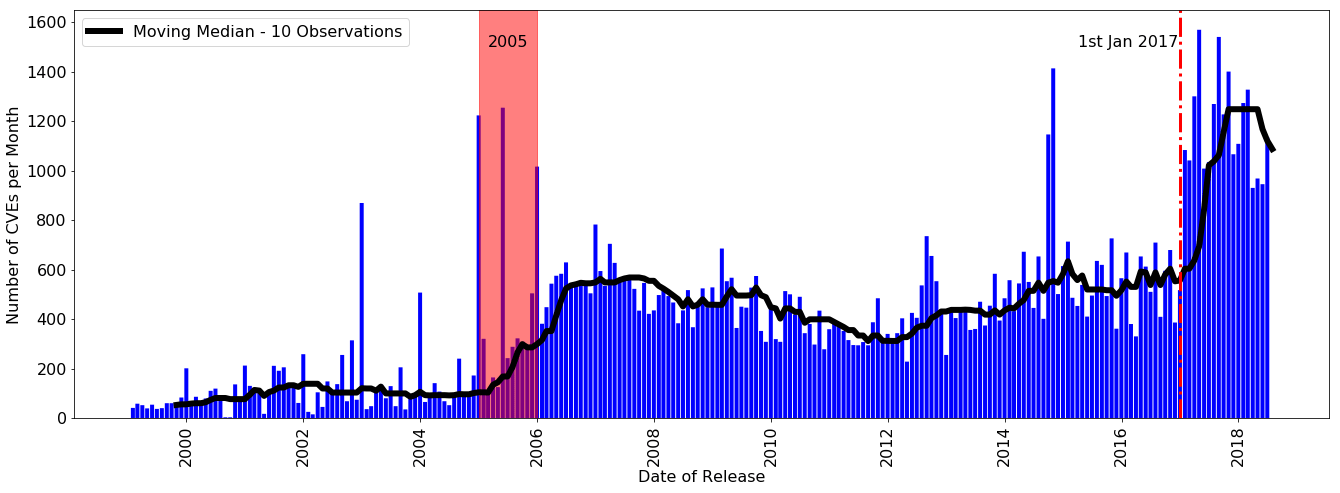
Number of Common Vulnerabilities and Exposures Database (CVE) Entries Disclosed per Month from 1999 to 2018. The CVE arrivals can be split into three distinct eras: (1) from 1999 to 2005, (2) from 2005 to 2017 and (3) from 2017 to date.
ACEMS researchers have used a combination of novel data sources, including virtual reality, aerial thermal-imaging and ground surveys to build a better statistical model for predicting the location of koalas and, ultimately, protecting their habitat. The study used the mashup of high-tech 360-degree imagery and heat-seeking drone cameras along with traditional techniques of ground surveys to develop a model that could be used to identify areas most likely to be home to koalas, which are facing population decline. This project was undertaken before the devastating 2019-2020 bushfires and is even more relevant afterwards as koalas are more endangered. This research, led by AIs Erin Peterson and Cath Leigh and CI Kerrie Mengersen, involved a number of undergraduate members of ACEMS, as well as PhD student Jacinta Holloway, and a range of external partners including koala NGOs, citizen science groups and other university research groups.
Complex networks present a range of issues for understanding data, from understanding aspects of the network, such as the diversity and complexity of its structure, to how the network interacts within itself, or even to how information flows through it. This presents problems for industries such as cybersecurity. In some cases, cybersecurity vulnerabilities can be so large that a level of prioritisation needs to be given to these vulnerabilities – specifically, assessments can apply a risk score called the CVSS or Common Vulnerability Scoring System which provides a way to capture the principal characteristics of a vulnerability and produce a numerical score reflecting its severity. CI Roughan is leading a team with PhD Student Feutrill and Yuval Yarom to investigate how this CVSS score allows agents to decide which are the most important vulnerabilities that require urgent attention and how to assess vulnerabilities in the time it takes between the discovery of a vulnerability and the moment it will be exploited. Recent work has shown how the management of these vulnerabilities can be improved using simple queueing theory.
Researchers at Adelaide have also been digging into the large dataset provided by Spotify Music Networks to understand the importance of relationships between creative artists. The dataset is a large, high-dimensional view of collaborations between artists. The challenges lie in developing analysis that is robust to the structured and complex noise in the data, in particular battling with critical transitions in the dynamics of the system. The team has developed new methods with better robustness properties.
CI Delaigle and her team have made progress on the analysis of fragments of functional data. Functional data usually appear in the form of a complete curve observed over a period of time. In the fragmented case, the data are only available for a small range over that period of time. Often, different individuals are observed on different ranges of data. For example, such data appear when patient or monitoring stations are monitored only over restricted periods of time. The team is investigating ways to deal with the situation where the length of the fragments depends on the nature of the fragment, a situation that occurs regularly in monitoring applications where the decision to stop monitoring depends on what has already been observed. The team has also developed sieve techniques for analysing partially observed functional data, which extends to more general forms than fragments. They have developed identifiability conditions which help understand the form of partially observed data from which inference is possible.
CI Delaigle and her team have also started investigating ways in which statistical techniques of inference for streaming data could be used to improve the analysis of traffic data. Streaming data are data that are collected as a stream over time. A challenge with these data is that since they are observed sequentially over time, it is difficult to analyse them with traditional statistical techniques as these typically rely on the fact that the data are all available at once. Traffic data are a typical example of such data. The team has been thinking of ways to adapt to those data some iterative techniques developed in the statistics literature for streaming data.
An important tool for testing hypotheses in statistics is the p-value. In real life, we always need to estimate a true p-value by the tail probability of the distribution, as the sample size grows, of the test statistic. When testing a hypothesis related to rare events, both the true p-value and the estimated p-value are close to zero as the sample size increases, which makes it difficult to quantify the accuracy of the estimated p-value. The moderate deviation theorem allows researchers to quantify the accuracy of this estimator in terms of an upper bound of the ratio of the estimated and the true p-values. It can be used to determine the smallest sample size needed to ensure that that ratio of the true and estimated p-values is close to one. In his project, Research Fellow Zhuosong Zhang used Stein’s method and an exchangeable pair approach to obtain a general moderate deviation result for arbitrary general random variables. The result is also applied to the subgraph counts in the Erdős–Rényi random graphs and a class of local dependent random variables.
Research at UNSW with CI Sisson and AI Beranger has focused on developing new statistical techniques for analysing data that have been summarised into distributional form, such as histograms and intervals. In a collaboration with CI Roughan at Adelaide, PhD student Prosha Rahman has developed new results for modelling internet traffic data, even after it has been heavily subsampled and summarised. Working with satellite data for crops from the ABS, PhD student Tom Whitaker developed new techniques for logistic regression when the predictors were summarised as histograms, allowing large datasets to be analysed in minutes rather than hours. Tom also developed new composite likelihood techniques for histogram-summarised data, the use of estimating equations to analyse interval and histogram-based data in a non-parametric framework, and applied these methods in the analysis of Athena Swan data from the UK, that had been heavily discretised for data privacy reasons.
Phylogenetics is the study of the evolutionary relationships among living organisms. Genetic information is the most common form of input data, and recent advances in DNA sequencing technologies has led to a rapid expansion in the amount of available data. There is a plethora of biological evidence that there exists significant heterogeneity in the evolutionary processes acting across the genome. Research Fellow Stephen Crotty has been working on the development of complex models of DNA sequence evolution that can better model the evolutionary process. In collaboration with researchers at Australian National University and the Center for Integrative Bioinformatics Vienna, Stephen has developed a mixture model which has the flexibility to infer biologically relevant phylogenetic signals from a wealth of noisy data.
Plans for 2020
Plans for 2020 are already well underway, and the following is a brief summary of what some ACEMS researchers across Australia are planning to do:
- Continue research on anomaly detection and high-dimensional time series analysis and forecasting. (Hyndman)
- Extend the work on groundwater bores in north eastern NSW to develop more sophisticated predictive models for bore water levels, as a function of rainfall, temperature, ocean surface temperature and other predictors. (Ryan)
- Develop a mathematical model of the cyber-security ecosystem’s evolution. (Roughan)
- Continue the exploration of traffic data. (Delaigle)
- Develop theory regarding the performance of likelihood-based inference for distributional-based data. (Sisson, Beranger, Rahman)
- Investigate approaches to optimally construct distributional data for optimal efficiency in an analysis. (Sisson, Beranger, McGree)
- Develop neural networks for model and method selection in phylogenetic inference. (Crotty)
- Investigate methods to escape/avoid local optima while carrying out phylogenetic inference using Maximum Likelihood. Early experiments based upon augmenting the likelihood surface by proposing alternative objective functions have shown promising results. (Crotty)
- Critically investigate the widespread use of information criteria for model selection in phylogenetics, and develop alternative, computationally feasible approaches. (Crotty)