
Acems R Software and Services
The majority of open-source code, software and packages contributed by ACEMS members is in the R language. R is a leading open-source language and environment globally for both researchers and data scientists, enabling statistical computing, data analysis, graphics, applications specific to a range of domains (such as genetics, econometrics, clinical trials and environmental monitoring), and much more, as shown in the Comprehensive R Archive Network’s CRAN topic areas page.
ACEMS R Software and Service highlights for 2019 include:
- ACEMS members have been active in creating and maintaining R Packages made publicly available for free download on CRAN, with tens of millions of downloads reflecting their popularity with CRAN users. These R Packages include:
- 15 new R Packages created in 2019, offering a diversity of functionalities and possible applications; and
- a total of 68 R Packages currently maintained on CRAN.
- ACEMS members additionally made at least nine contributions of new code or software (in languages including R and Python), plus one data set, to other repositories such as GitHub in 2019.
- ACEMS members provided a range of services to enable end users and the public to learn about and use these R packages and other open source tools, including:
- speaking at conferences;
- delivering training workshops; and
- hosting, mentoring at, or participating in hackathons.
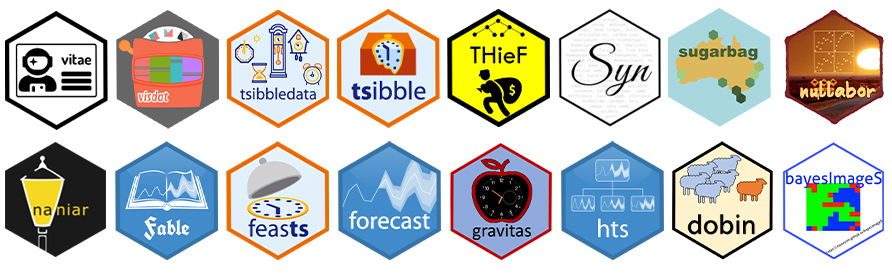
A variety of R Packages, including 2019 packages created by ACEMS members
New R Packages Created in 2019
ACEMS members added 15 new R packages to CRAN in 2019. Table 1 below includes details about the functionality of each package and links to the software on CRAN. Already, each of these packages has enjoyed high downloads, ranging from hundreds to more than ten thousand downloads in 2019, as detailed in Figures 1 and 2.
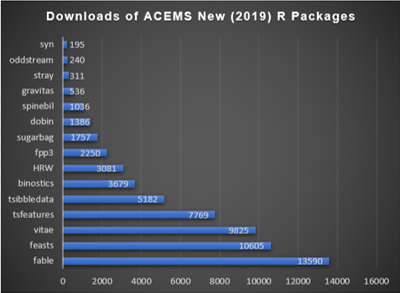
Figure 1 shows the total download of ACEMS members' new R Packages in 2019
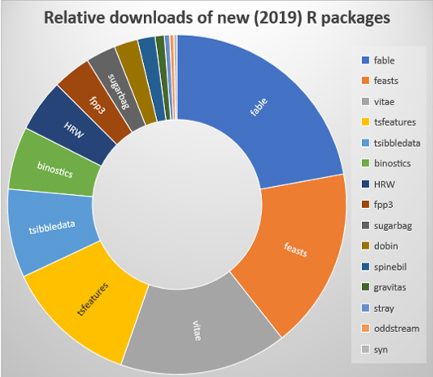
Figure 2 shows the relative downloads of ACEMS members' new R Packages in 2019
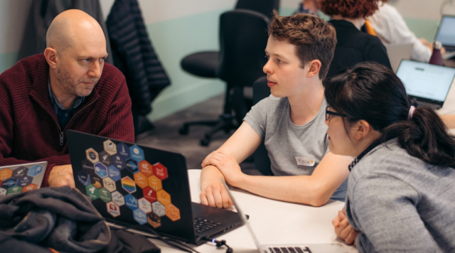
Figure 3: ACEMS Chief Investigator Professor Rob Hyndman with ACEMS Affiliate Mitchell O’Hara-Wild and ACEMS Associate Investigator Emi Tanaka at the ACEMS co-hosted Unconference Australia hackathon working on the vitae package which has been downloaded 9825 times in 2019. The vitae package makes creating and maintaining a résumé or CV with R Markdown simple. It provides a collection of LaTeX templates, with helpful functions to add content to the documents. These functions allow you to dynamically include CV entries from any data source, which is particularly useful when this data is obtained/prepared by other R packages. Some examples of what this allows you to do includes: automatically get your work experience from the web; list the R packages you have contributed to; filter CV entries by keywords relevant to the current job; and include your academic publications.
The top three new R packages for 2019 are: fable which stands for “Forecasting Models for Tidy Time Series” (13,590 downloads); feasts, for “Feature Extraction and Statistics for Time Series” (10,605 downloads), as featured in the case study below; and vitae for curriculum vitae management (9,825 downloads) which was created in a hackathon as shown and described in Figure 3.
Additionally, in 2019 ACEMS members made at least nine contributions of code or software, plus one new data set, to repositories other than CRAN, such as GitHub; these are listed in Table 2.
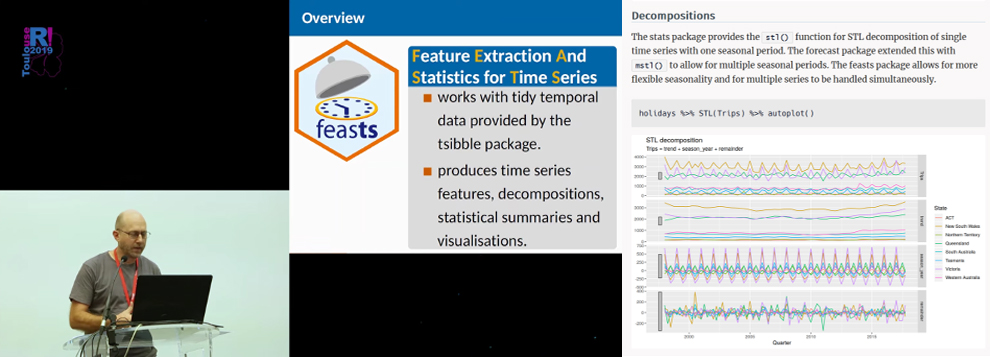
ACEMS CI Rob Hyndman delivers a presentation on his new R package, feasts, and shares more information on his website
Case Study: FEASTS – A New Data Science Tool for Handling High Frequency Time Series Data
The feasts package is a powerful tool for data scientists and researchers handling big data at high frequency (versus low frequency annual, monthly or quarterly data), and has been downloaded more than 10,605 times since first released in August 2019. Its authors include ACEMS Affiliate and Research Assistant Mitchell O’Hara-Wild (the maintainer), ACEMS Chief Investigator Professor Rob Hyndman (pictured), and ACEMS PhD student Earo Wang.
The feasts package forms part of a new collection of tidyverts packages designed for modern time series analysis using the tidyverse framework and structures. It uses the tsibble package to provide the basic data class and data manipulation tools.
The feasts package provides ‘Feature Extraction And Statistics for Time Series’, and includes tools for exploratory data analysis, data visualisation, and data summary. For example, it includes autocorrelation plots, seasonality plots, time series decomposition, tests for units roots and autocorrelations. Its advantage is in handling large collections of related time series data in an efficient and user-friendly manner.
ACEMS ‘feasts’ package co-author Professor Rob Hyndman, provides worked examples of possible uses of the feasts package, including as illustrated in the extract above from his website.
Table 1: Details of New R Packages Created in 2019 by ACEMS members.
Packages with an asterisk (*) were created specifically with ACEMS funding.
| R Package | Maintainer | Package Title | Description | count |
|---|---|---|---|---|
| fable | Mitchell O'Hara-Wild | Forecasting Models for Tidy Time Series | Provides a collection of commonly used univariate and multivariate time series forecasting models including automatically selected exponential smoothing (ETS) and autoregressive integrated moving average (ARIMA) models. These models work within the 'fable' framework provided by the 'fabletools' package, which provides the tools to evaluate, visualise, and combine models in a workflow consistent with the tidyverse. | 13590 |
| feasts | Mitchell O'Hara-Wild | Feature Extraction and Statistics for Time Series | Provides a collection of features, decomposition methods, statistical summaries and graphics functions for the analysing tidy time series data. The package name 'feasts' is an acronym comprising of its key features: Feature Extraction And Statistics for Time Series. | 10605 |
| vitae | Mitchell O'Hara-Wild | Curriculum Vitae for R Markdown | Provides templates and functions to simplify the production and maintenance of curriculum vitae. | 9825 |
| tsfeatures | Rob Hyndman | Time Series Feature Extraction | Methods for extracting various features from time series data. The features provided are those from Hyndman, Wang and Laptev (2013) <doi:10.1109/ICDMW.2015.104>, Kang, Hyndman and Smith-Miles (2017) <doi:10.1016/j.ijforecast.2016.09.004> and from Fulcher, Little and Jones (2013) <doi:10.1098/rsif.2013.0048>. Features include spectral entropy, autocorrelations, measures of the strength of seasonality and trend, and so on. Users can also define their own feature functions. | 7769 |
| tsibbledata | Mitchell O'Hara-Wild | Diverse Datasets for 'tsibble' | Provides diverse datasets in the 'tsibble' data structure. These datasets are useful for learning and demonstrating how tidy temporal data can tidied, visualised, and forecasted. | 5182 |
| binostics | Ursula Laa | Compute Scagnostics | Calculates graph theoretic scagnostics. Scagnostics describe various measures of interest for pairs of variables, based on their appearance on a scatterplot. They are useful tool for discovering interesting or unusual scatterplots from a scatterplot matrix, without having to look at every individual plot. | 3679 |
| HRW | Matt Wand | Datasets, Functions and Scripts for Semiparametric Regression Supporting Harezlak, Ruppert & Wand (2018) | The book "Semiparametric Regression with R" by J. Harezlak, D. Ruppert & M.P. Wand (2018, Springer; ISBN: 978-1-4939-8851-8) makes use of datasets and scripts to explain semiparametric regression concepts. Each of the book's scripts are contained in this package as well as datasets that are not within other R packages. Functions that aid semiparametric regression analysis are also included. | 3081 |
| fpp3 | Rob Hyndman | Data for "Forecasting: Principles and Practice" | All data sets required for the examples and exercises in the book "Forecasting: principles and practice" by Rob J Hyndman and George Athanasopoulos <http://OTexts.org/fpp3/>. All packages required to run the examples are also loaded. | 2250 |
| sugarbag* | Stephanie Kobakian | Create Tessellated Hexagon Maps | Create a hexagon tilegram from spatial polygons. Each polygon is represented by a hexagon tile, placed as close to its original centroid as possible, with a focus on maintaining spatial relationship to a focal point. Developed to aid visualisation and analysis of spatial distributions across Australia, which can be challenging due to the concentration of the population on the coast and wide-open interior. | 1757 |
| dobin | Sevvandi Kandanaarachchi | Dimension Reduction for Outlier Detection | A dimension reduction technique for outlier detection. DOBIN: a Distance-based Outlier BasIs using Neighbours, constructs a set of basis vectors for outlier detection. This is not an outlier detection method; rather it is a pre-processing method for outlier detection. It brings outliers to the fore-front using fewer basis vectors (Kandanaarachchi, Hyndman 2019) <doi:10.13140/RG.2.2.15437.18403>. | 1386 |
| gravitas | Sayani Gupta | Explore Probability Distributions for Bivariate Temporal Granularities | Provides tools for systematically exploring large quantities of temporal data across nonlinear temporal granularities (deconstructions of time) by visualising probability distributions. Nonlinear time granularities can be circular, quasi-circular or aperiodic. 'gravitas' computes nonlinear single-order-up or multiple-order-up granularities, check the feasibility of creating plots for any two nonlinear granularities and recommend probability distributions plots for exploring periodicity in the data. | 536 |
| spinebil | Ursula Laa | Investigating New Projection Pursuit Index Functions | Projection pursuit is used to find interesting low-dimensional projections of high-dimensional data by optimizing an index over all possible projections. The 'spinebil' package contains methods to evaluate the performance of projection pursuit index functions using tour methods, as described in Laa & Cook (2019) <arXiv:1902.00181>. | 1036 |
| stray* | Priyanga Dilini Talagala | Anomaly Detection in High Dimensional and Temporal Data | This is a modification of 'HDoutliers' package. The 'HDoutliers' algorithm is a powerful unsupervised algorithm for detecting anomalies in high-dimensional data, with a strong theoretical foundation. However, it suffers from some limitations that significantly hinder its performance level, under certain circumstances. This package implements the algorithm proposed in Talagala, Hyndman and Smith-Miles (2019) <arXiv:1908.04000> for detecting anomalies in high-dimensional data that addresses these limitations of 'HDoutliers' algorithm. We define an anomaly as an observation that deviates markedly from the majority with a large distance gap. An approach based on extreme value theory is used for the anomalous threshold calculation. | 311 |
| oddstream* | Priyanga Dilini Talagala | Outlier Detection in Data Streams | We propose a framework that provides real time support for early detection of anomalous series within a large collection of streaming time series data. By definition, anomalies are rare in comparison to a system's typical behaviour. We define an anomaly as an observation that is very unlikely given the forecast distribution. The algorithm first forecasts a boundary for the system's typical behaviour using a representative sample of the typical behaviour of the system. An approach based on extreme value theory is used for this boundary prediction process. Then a sliding window is used to test for anomalous series within the newly arrived collection of series. Feature based representation of time series is used as the input to the model. To cope with concept drift, the forecast boundary for the system's typical behaviour is updated periodically. More details regarding the algorithm can be found in Talagala, P. D., Hyndman, R. J., Smith-Miles, K., et al. (2019) <doi:10.1080/10618600.2019.1617160>. | 240 |
| syn | Nicholas Tierney | Creates Synonyms From Target Words | Generates synonyms from a given word drawing from a synonym list from the 'moby' project. View here | 195 |
Use of New R Packages
The number of downloads of ACEMS members’ R packages is one indicator of their value to end users. Figures 1 and 2 below show the total and relative number of downloads, respectively, of ACEMS members’ new R packages (created in 2019) from CRAN in 2019.
Figure 1 shows the total download of ACEMS members' new R Packages in 2019
Figure 2 shows the relative downloads of ACEMS members' new R Packages in 2019
These numbers are expected to increase over time, as evidenced by the cumulative total downloads of all ACEMS R packages created in earlier years.
New contributions to repositories other than CRAN
Table 2 provides details of ACEMS members’ 2019 contributions to repositories other than CRAN, including GitHub. These contributions comprised nine packages (of source code/software) and one data set.
Table 2: ACEMS members’ open source code, software and data contributions in 2019
to GitHub and other repositories (aside from CRAN) (including programs in R and Python). All these items were created specifically with ACEMS funding.
| Product | Description of Function | Details |
|---|---|---|
| Sparti | Sparti is a statistical software package for spatial partition inference such as inference methods for the Mondrian Process, the Binary Space Partitioning-Tree Process, the Rectangular Bounding Process. Currently, Markov chain Monte Carlo method is the main strategy for the inference. | Fan, X. (2019). Sparti. Retrieved from View here |
| Riskmapr | The suite of riskmapr Shiny apps implement Bayesian network models to produce spatial risk maps for invasive weeds. The repository also contains the data required to reproduce the case studies and sensitivity analyses outlined in the associated publication: Froese, Pearse & Hamilton (in press). | Froese, J. G., Pearse, A. R., & Hamilton, G. S. (2019). riskmapr. View here |
| GRATIS | The R package gratis (previously known as tsgeneration) provides efficient algorithms for generating time series with diverse and controllable characteristics. | Kang, Y., Li, F., & Hyndman, R. J. (2019). GRATIS: GeneRAting TIme Series with diverse and controllable characteristics. Retrieved from View here |
| EMpht.jl | A Julia port of the EMpht.c program, used for fitting Phase-Type distributions via an EM algorithm. | Laub, P. J. (2019). EMpht.jl. Retrieved from View here |
| monodomain2D | Simple MATLAB code for solution of the Monodomain equation in 2D. Assumes a regular grid but allows for user to specify heterogeneous diffusion tensors and blocked regions. | Lawson, B. A. J., Santos, R. W. dos, & Turner, I. (2019). Two-dimensional monodomain solver. Retrieved from View here |
| SSNdesign | SSNdesign is an R package for solving optimal and adaptive designproblems onstream networks that integrates with existing open-source software | Pearse, A., Peterson, E. E., McGree, J., Leigh, C., Hoef, J. Ver, & Som, N. (2019). SSNdesign – an R package for pseudo-Bayesian optimal and adaptive sampling designs on stream networks. |
| ProcessEntropy | A toolkit for calculating process entropy quickly. With specific applications to tweets. | South, T. (2019). ProcessEntropy. Retrieved from View here |
| deconvolve | This package provides tools for performing non-parametric deconvolution on measurement error problems. It contains functions for finding bandwidths, deconvolved densities and non-parametric regression estimates. | Delaigle, A., Hyndman, T., & Wang, T. (2019). deconvolve: Deconvolution tools for measurement error problems. View here |
| RicherPriorsForMLPs (Supplementary Code) |
(Python Language) Code to supplement "Richer priors for infinitely wide multi-layer perceptrons" | Tsuchida, R. (2019). Code to supplement "Richer priors for infinitely wide multi-layer perceptrons". |
| Tea (Data Set) | Data added for R package for tea exporting countries. | Talagala, T. (2019). tea: R package for tea exporting countries. Retrieved from View here |
ACEMS Publicly Available R Packages
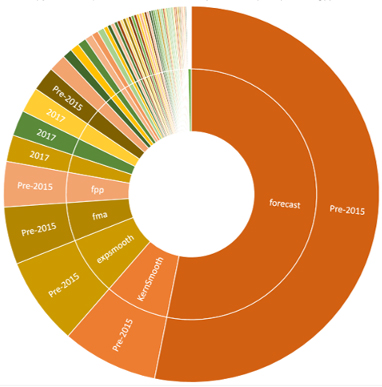
Figure 4: Relative number of total downloads of ACEMS R Packages in 2019 (for packages created Pre-2015 to 2019)
ACEMS members maintain a diversity of R Packages which remain popular amongst CRAN’s diversity of international users. There are currently 68 R Packages created by ACEMS members and maintained on CRAN; Table 3 below provides the details and total user download numbers for 2019 in descending order. Whilst total downloads are an indicator of value to end users, some packages with smaller downloads may have niche user groups and/or otherwise deliver significant impact from use.
The most popular R Package by download is forecast – with more than 2 million total downloads by CRAN users – which is also amongst the earliest released packages which continue to be popular, as highlighted in Figure 4, showing relative total downloads of packages grouped by release years.
User downloads of ACEMS R Packages continue to grow over time, with nearly four million (3,874,049) total downloads for 2019, and approaching thirteen million (12,775,757) total downloads of ACEMS members’ CRAN packages since 2014.
Table 3: Downloads for all ACEMS members’ R packages maintained and updated on CRAN
| R Package | Maintainer | Current Version | User Downloads |
|---|---|---|---|
| forecast | Rob Hyndman | 8.11 | 2058621 |
| KernSmooth | Brian Ripley | 2.23-16 | 319941 |
| expsmooth | Rob J Hyndman | 2.3 | 293358 |
| fma | Rob Hyndman | 2.4 | 191157 |
| fpp | Rob J Hyndman | 0.5 | 151036 |
| fpp2 | Rob Hyndman | 2.3 | 88340 |
| visdat | Nicholas Tierney | 0.5.3 | 85353 |
| naniar | Nicholas Tierney | 0.5.0 | 84577 |
| hts | Earo Wang | 5.1.5 | 81884 |
| tsibble | Earo Wang | 0.8.6 | 57958 |
| thief | Rob Hyndman | 0.3 | 32629 |
| hdrcde | Rob Hyndman | 3.3 | 29927 |
| ftsa | Han Lin Shang | 5.5 | 29378 |
| Mcomp | Rob Hyndman | 2.8 | 25160 |
| rainbow | Han Lin Shang | 3.6 | 22460 |
| demography | Rob J Hyndman | 1.22 | 21909 |
| fable | Mitchell O'Hara-Wild | 0.1.2 | 13590 |
| bfast | Jan Verbesselt | 1.5.7 | 12351 |
| CEoptim | Benoit Liquet | 1.2 | 12329 |
| feasts | Mitchell O'Hara-Wild | 0.1.2 | 10605 |
| feature | Tarn Duong | 1.2.13 | 10255 |
| vitae | Mitchell O'Hara-Wild | 0.2.1 | 9825 |
| LowRankQP | Matt Wand | 1.0.3 | 9789 |
| shinycustomloader | Emi Tanaka | 0.9.0 | 9768 |
| tourr | Di Cook | 0.5.6 | 9446 |
| robets | Ruben Crevits | 1.4 | 9333 |
| bayesImageS | Matt Moores | 0.6-0 | 9145 |
| season | Adrian Barnett | 0.3.9 | 9033 |
| sugrrants | Earo Wang | 0.2.5 | 8924 |
| nullabor | Di Cook | 0.3.9 | 8686 |
| staplr | Priyanga Dilini Talagala | 2.9.0 | 7933 |
| tsfeatures | Rob Hyndman | 1.0.1 | 7769 |
| curvHDR | Matt Wand | 1.2-1 | 7221 |
| SSN | Jay Ver Hoef | 1.1.14 | 7085 |
| DescribeDisplay | Di Cook | 0.2.7 | 6545 |
| BSL | Ziwen An | 3.0.0 | 6523 |
| binb | Dirk Eddelbuettel | 0.0.5 | 6506 |
| stR | Alexander Dokumentov | 0.4 | 6283 |
| fds | Han Lin Shang | 1.8 | 6160 |
| gammSlice | Matt Wand | 2.0-2 | 5674 |
| edrGraphicalTools | Benoit Liquet | 2.2 | 5666 |
| emma | Laura Villanova | 0.1-0 | 5650 |
| dobson | Adrian Barnett | 0.4 | 5592 |
| tsibbledata | Mitchell O'Hara-Wild | 0.1.0 | 5182 |
| ggquiver | Mitchell O'Hara-Wild | 0.2.0 | 4972 |
| sgPLS | Benoit Liquet | 1.7 | 4857 |
| rwalkr | Earo Wang | 0.5.1 | 4815 |
| glmmEP | Matt Wand | 1.0-3.1 | 4634 |
| eechidna | Jeremy Forbes | 1.4.0 | 4291 |
| queuecomputer | Anthony Ebert | 0.8.3 | 4216 |
| colmozzie | Thiyanga Talagala | 1.1.1 | 3949 |
| smoothAPC | Alexander Dokumentov | 0.3 | 3824 |
| MBSGS | Benoit Liquet | 1.1.0 | 3757 |
| diffpriv | Benjamin Rubinstein | 0.4.2 | 3696 |
| binostics | Ursula Laa | 0.1.2 | 3679 |
| serrsBayes | Matt Moores | 0.4-1 | 3620 |
| mozzie | Thiyanga Talagala | 0.1.0 | 3402 |
| HRW | Matt Wand | 1.0-3 | 3081 |
| taipan | Stephanie Kobakian | 0.1.2 | 2989 |
| fpp3 | Rob Hyndman | 0.1 | 2250 |
| sugarbag | Stephanie Kobakian | 0.1.2 | 1757 |
| dobin | Sevvandi Kandanaarachchi | 1.0.2 | 1386 |
| spinebil | Ursula Laa | 0.1.0 | 1036 |
| gravitas | Sayani Gupta | 0.1.2 | 536 |
| stray | Priyanga Dilini Talagala | 0.1.0 | 311 |
| oddstream | Priyanga Dilini Talagala | 0.5.0 | 240 |
| syn | Nicholas Tierney | 0.1.0 | 195 |
Helping Users to Harness ACEMS Tools
ACEMS R packages and other data science tools can be used by a diversity of people in a myriad of ways, including in research, education, training, within organisations, in hackathons, for innovation, to solve problems, and to design and create new solutions.
To help others use and harness the potential of the Centre’s R software packages and other open source tools, ACEMS members also provide a range of enabling services, such as delivering education and practical training, consulting, and creating resources for other creators and users of these tools. These services can help users to:
- develop coding and data science skills;
- better work with and yield new value from data; and
- understand a particular package’s relative strengths, limitations, and potential, including in different contexts, subject to resource constraints, and translating prototypes to real world solutions that work at scale.
Some highlights from ACEMS members work in 2019 with open source software end users are provided below, including in collaboration with the United Nations, to help with monitoring progress towards Sustainable Development Goals (SDGs), and RForwards, to encourage girls to get involved
Case Study: ACEMS-UN Training for Users to Harness Free Tools for SDG monitoring
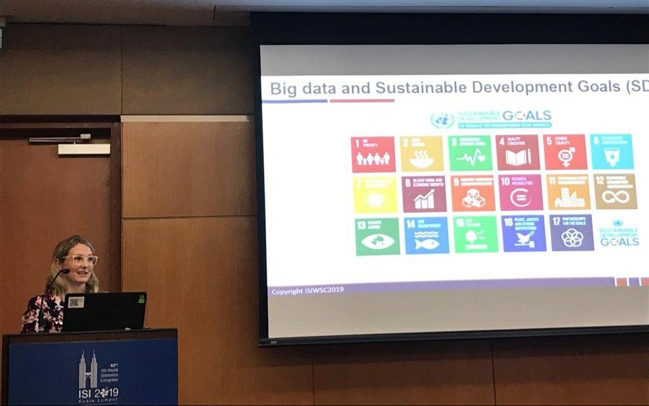
ACEMS’ PhD student Jacinta Holloway delivering a presentation on tools and methods for overcoming missing data problems when using free satellite images to monitor SDGs.
Satellite image analysis to monitor Sustainable Development Goals Satellite images are a useful data source identified by the United Nations for monitoring sustainable development goals (SDGs) such as forest cover around the world. A key issue with these free images are missing data due to cloud cover, particularly in tropical areas where forest monitoring is most important. There are approaches to fill these gaps such as compositing and kriging methods, however these are not ideal solutions.
Jacinta Holloway’s PhD studies have investigated new machine learning approaches and findings about filling missing data gaps in satellite images due to clouds. Read the paper here:https://www.mdpi.com/2072-4292/11/15/1796.
Jacinta Holloway
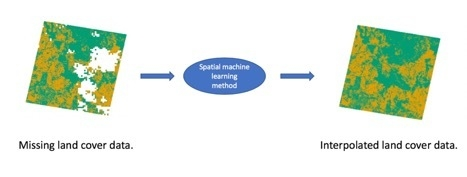
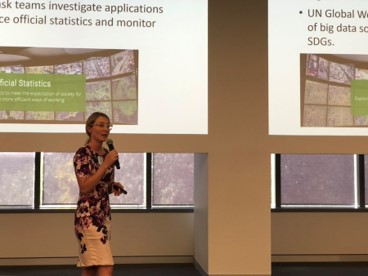
Content from Jacinta's presentation regarding the use of spatial machine learning method to deal with missing land cover data
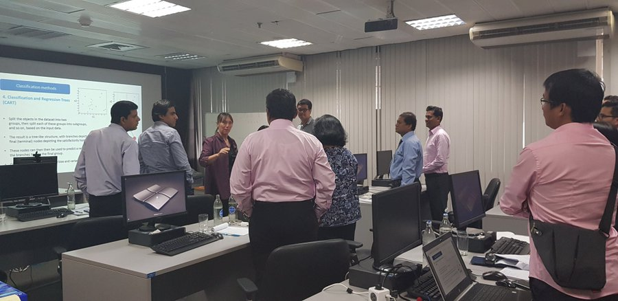
ACEMS CI Kerrie Mengersen in a UN supported training workshop
In 2019, Jacinta presented her research at the 2019 World Statistics Congress in Kuala Lumpur in an invited session about Sustainable Development Goals, showing how end users can fill gaps in freely available satellite images to monitor forest cover. Prior to this, she and ACEMS CI Kerrie Mengersen, have taught a number of workshops to enable representatives from other countries to use a cost-effective tool for SDG monitoring, covering topics including classifying data with classification and regression trees.
The UN satellite imagery task team, which Jacinta and Kerrie have been part of since 2014, requested access to Jacinta’s code for simulating clouds and for the methods to share with statistical offices and other users through the online service called the UN Global Platform. Work towards implementing the code in the platform is ongoing, and will help more developing countries and end users to make better use of satellite images to monitor their environments and progress towards Sustainable Development Goals.
Case Study: Training High School Girls to Code and Understand Biodiversity
In May 2019, ACEMS collaborated with R Forwards - the R Foundation’s taskforce on women and other under-represented groups - to host a free full-day R coding training workshop for Year 11 girls to learn R and then apply their skills to explore biodiversity, using data in the Atlas of Living Australia. After spending the morning learning to code, the girls were invited to form teams and build a web app to explore local wildlife. The benefits from such a collaborative event included increasing girls’ participation, skills, and practical success in coding, and raising their awareness about biodiversity.

Collaborator RForwards is an R Foundation taskforce with a goal to include women

The Atlas of Living Australia website
Read about the use, development and new applications for R software at hackathons such as 2019 ROpenSci OzUnconference in the following section.
Hackathons Using Open Source Software
Hackathons provide an effective forum and means to develop capabilities, connections, ideas, solutions, and new open source, including R, software, packages and applications. ACEMS has organised, mentored at, and participated in many hackathons, including the ROpenSci hackathon.
In December 2019, ACEMS co-hosted the 2019 ROpenSci OzUnconference in Sydney, bringing together R experts, enthusiasts, and beginners, all with an interest in learning and building software and tools by teaming together.
Members of ACEMS, including Chief Investigator Professor Rob Hyndman, and Associate Investigators Professor Dianne Cook and Dr Nick Tierney, were there to help and collaborate with participants. Nick, the lead organiser of the ROpenSci OzUnconference for the past three years, lent his support to the new organisers and delivered a Git 101 workshop on building R packages and using git and GitHub.
Unconference teams applied their knowledge and skills by teaming together to work on a range of projects, including: addressing environmental and health concerns related to the Australian fires and smoke; understanding PISA scores in maths; building tools for academic careers; art creation; and more.
ACEMS has supported the ROpenSci Unconference in Australia since inception, to realise a myriad of benefits including: the development of participant skills, knowledge, connections, and team work (across disciplines and sectors); helping to seed and develop projects with potential impact.
To learn more, view unconference projects here, and see photos from the event and read a blog post about it here.

A tweet featuring a team at the R Unconference, Australia, including ACEMS AI Professor Dianne Cook, Paul Yacobellis (visiting data scientist from USA), ACEMS AI Dr Nick Tierney, Kim Fitter (NZ R Ladies), Giulio Valentino Dalla Riva (Uni of Canterbury, NZ), Sarah Romanes (Uni of Sydney) and Erika Siregar (Indonesia R Ladies), working with PISA data in an R package to analyse Australian students’ maths performance.
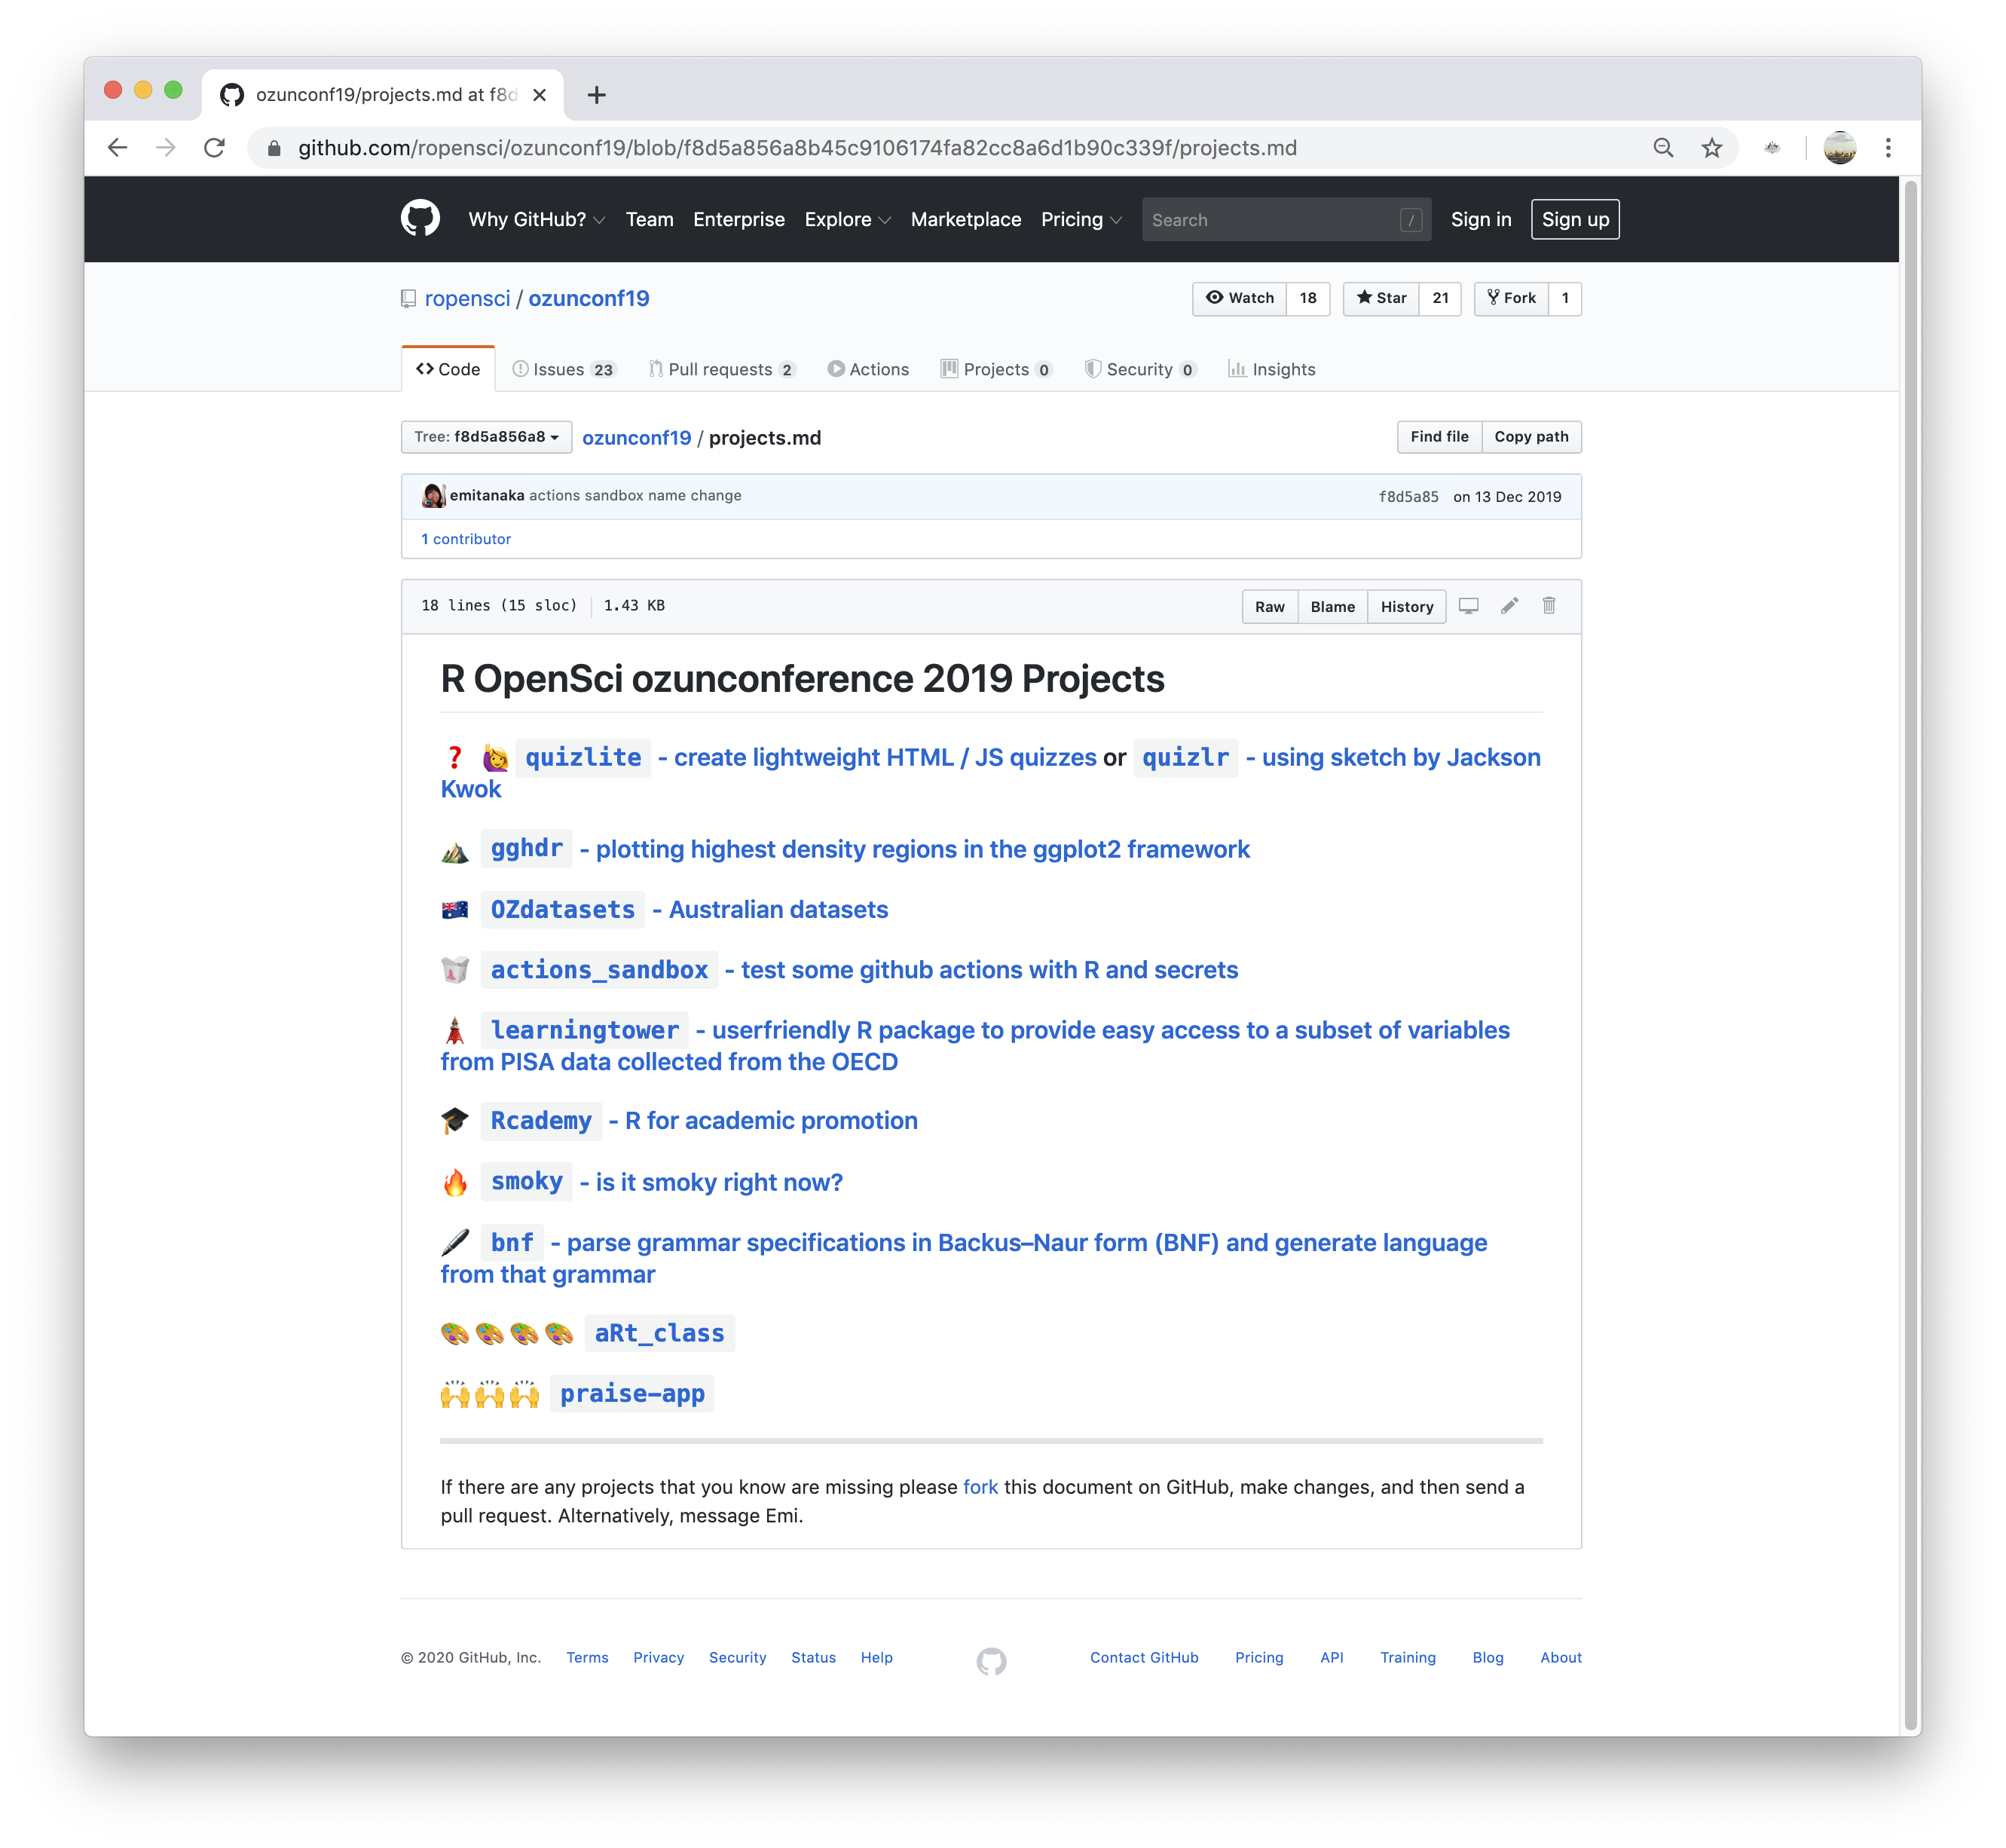
Teams worked on a range of projects at the 2019 ROpenSci OzUnconference using R packages and shared their work on GitHub